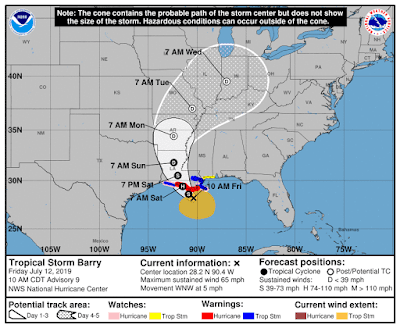
Our pal Barry is no longer a Tropical Storm today! Ladies and Gentlemen, meet Tropical Storm Barry...
He is currently at 28.2N, 90.4W and is heading WNW still at a sedate 5mph. His track is taking him into the Louisiana coast tomorrow:
More-or-less on the track they had yesterday. At one day away from landfall, the NHC track is relatively good so I would go with this (but I'd still be ready if you are a little to the west - keep an eye on the entire cone, not just the center part).
He has been under some wind shear from the north, so it is still a little tricky to pinpoint his exact center of circulation:
But you can see that his convection (clouds, rain etc) has improved since yesterday - because of the wind shear though, they are still to the south of the center. This is because he's been loitering mischievously over warm waters where the sea surface temperatures in are over 30 deg C, with the upper 75 m warmer of the water being warmer than 26 deg C. A storm need around 26 deg C and higher temperatures to sustain itself, so he's got enough on the buffet menu to be a happy chappy. And that convection offshore is certainly very strong. We can see this from the InfraRed Satellite imagary (red means very thundery weather):
At the moment his biggest issue though is storm surge because he is pushing water onto the coast to the east, and in this case. To look at water levels for yourself...
<Technical Alert!> How to look up Storm Surge: Go to NOAA's website: tidesandcurrents (https://tidesandcurrents.noaa.gov/). If you click on this link, you will see an ugly cartoonish bad-suntan coloured map of the US (in shades of orange to represent the land). Click on the state that you are interested in e.g. Louisiana. This will show you a much nicer colour map with a bunch of pins. These are the locations of the stations. You have to be careful though (if you are on a Mac especially) because the map is not static so you can accidentally scroll around and end up in the middle of the Atlantic, and will have to zoom out until the map you want re-appears and then zoom back in!
You can either locate the nearest station by entering the area you are interested in, or zoom into the map. Click on that station, and in the lower left is a button that says 'plot'. Click that on and it will show you a plot of the expected water level (in red) and the actual measured water level (in blue). I went to the New Canal Station in New Orleans (just out of curiosity):
By scrolling your mouse over the plot, the numbers appear showing the actual values (and then you have to do some complicated maths to get to the difference between the two - in the good old days, they did this for you. Sigh.). In this case, water level at that location is currently almost 3ft above normal... because the winds have been pushing water into that area for over a day now.
If you want to see the corresponding winds, air pressure and other handy-dandy data, you can scroll down. <End Technical Alert!>
That's it for now as I must run because I've got third dinner in The Shire in a few minutes...
Ciao for now,
J.
Twitter: jyovianstorm
--------------------------------------
DISCLAIMER:These remarks are just what I think/see regarding tropical storms. If you are making an evacuation decision, please heed your local emergency management and the National Hurricane Center's official forecast. This is not an official forecast.
--------------------------------------


No comments:
Post a Comment