May I just say, Cookies and Cream Ice Cream is
SO Yummy. J
I see that there are a couple of little Blobs out
there…
And now that you know all about vorticity (from the last update), here are the vorticity
(circulation) maps at the lowest level of the troposphere and in the middle of
the troposphere:
The first Blob to look at is the one in the
Caribbean, just off the coast of Colombia (thanks Keith L for catching the original spelling mistake: Columbia is the University, Colombia is the country! :-)). Although there is some convection,
which you can see in the satellite image, the circulation (vorticity) is all
over the place so for now, I’ll just put this one aside.
The second Blob to look at is the one in the
Atlantic – it’s actually easier to spot in the vorticity (circulation) maps
than the satellite imagery. It’s the elongated red area just north of 10N, between
25-35W. Again, this is not really well formed yet because it is an elongated
region, not confined and round as we expect with tropical storms. Also, the
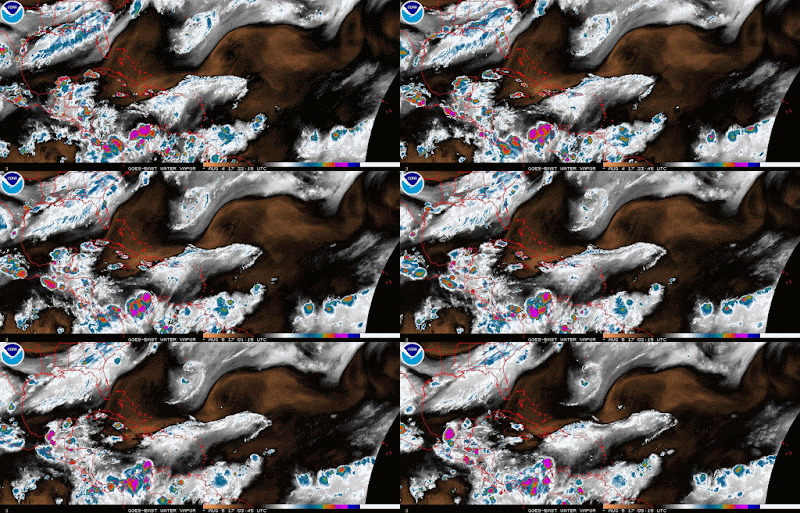
convection is not well developed either, partly because it is surrounded by very
dry air as you can see from the water vapour (with a 'u' :-)) satellite image (brown is dry air):
and because it is running into a bit of Sarahan
Air Layer:
It will remain suppressed until it clears that
dry and dusty air, so it is a little too soon to say whether it will become anything substantial.
The key is to look at the vorticity field and watch for any developments there.
That it has not really changed much all day however this is one I will keep
an eye on. So, for anyone traveling to a Caribbean region in the next week or two (e.g. me… oopsies :-) or Guy!), there is a chance for development but
it is too soon to say right now what that development will look like or where
it will go – the pressure field data is pretty poor out there at the moment. I’ll
be back tomorrow with a quick update.
But before I go, I think I was going to tell
you where to look for those deliciously useful and delightfully colourful vorticity maps for yourselves! Yes... it’s time for
the good stuff (&;ltTechnical Alert!&;gt) - good, but not as good as ice cream of course! ;-)
-->
<Technical Alert!>
To
see how the vorticity has changed over time, at the top, next to the ‘Home’ tab is a ‘Time
Step’ tab – you can go back in increments of 3 hours and watch how a storm has
evolved. This is how I know that the structure of the Atlantic Blob has not changed
very much today. And that’s it. Easy, right? J <End Technical Alert!>
Time to get a bit of a nap now. I’ll check in on the
Blobs tomorrow and will be back if there is even a smidgen of change.
Toodle pip for now!
J.
J.
-->
Blogs archived at http://jyotikastorms.blogspot.com/
Twitter @JyovianStorm
-------------------------------
DISCLAIMER: These remarks are just what I think/see regarding tropical storms - not the opinion of any organization I represent. If you are making an evacuation decision, please heed your local emergency management and the National Hurricane Center's official forecast and the National Weather Service announcements. This is not an official forecast. If I "run away, run away" (Monty Python), I'll let you know.
-->
Twitter @JyovianStorm
-------------------------------
DISCLAIMER: These remarks are just what I think/see regarding tropical storms - not the opinion of any organization I represent. If you are making an evacuation decision, please heed your local emergency management and the National Hurricane Center's official forecast and the National Weather Service announcements. This is not an official forecast. If I "run away, run away" (Monty Python), I'll let you know.


No comments:
Post a Comment